Titanic: 1.00000. - Top 1 House Prices: 0.00000. - Top 1
Both scores are theoretically impossible for a machine learning model to reach. Titanic’s 1.00000 means every single one of 418 test-set passengers classified correctly. House Prices’ 0.00000 means zero RMS log error on every test row. These are not the scores of a better model. They point instead to AI-driven optimization of the leaderboard itself: finding leakage, shortcuts, or submission strategies that maximize the reported score rather than improve genuine generalization.
The Original Attempt (~2019)
During my student times, I completed Andrew Ng’s Machine Learning and Deep Learning Specialization courses on Coursera. Both were extremely popular at the time and remain among the few courses I would still recommend today. Participating in public challenges was a natural next step, and Kaggle was the obvious choice (the community was thriving back then).
I took part in several competitions, but like many Kaggle newcomers, I started with Titanic (a standard classification problem) and House Prices (a standard regression problem). My pipeline for tabular ML problems followed a consistent structure:
- Initial analysis and data inspection - primarily Exploratory Data Analysis (EDA). Before touching a feature, I wanted to understand column dtypes, null counts, raw row counts, and basic descriptive statistics.
- Data visualization - various plots and distribution maps to build intuition about the raw data.
- Data cleansing - handling nulls, dropping irrelevant columns, resolving inconsistencies, and standardizing values where necessary.
- Feature engineering - transforming raw columns into model-ready numerics through encoding, scaling, binning, and other problem-specific transformations.
- Modelling - one model family per notebook, using k-fold cross-validation with hyperparameter search. For Titanic I used tree-based models (ExtraTrees with aggressive binning), for House Prices it was Lasso (LassoCV on the log-transformed target).
- Evaluation, submission, and review - train/test/cross-validation prediction scores, learning curves, and similar diagnostics, followed by a submission CSV and another iteration to find a better combination.
The notebooks still exist (archived) and can be read as-is: the Titanic notebook and the House Prices notebook.
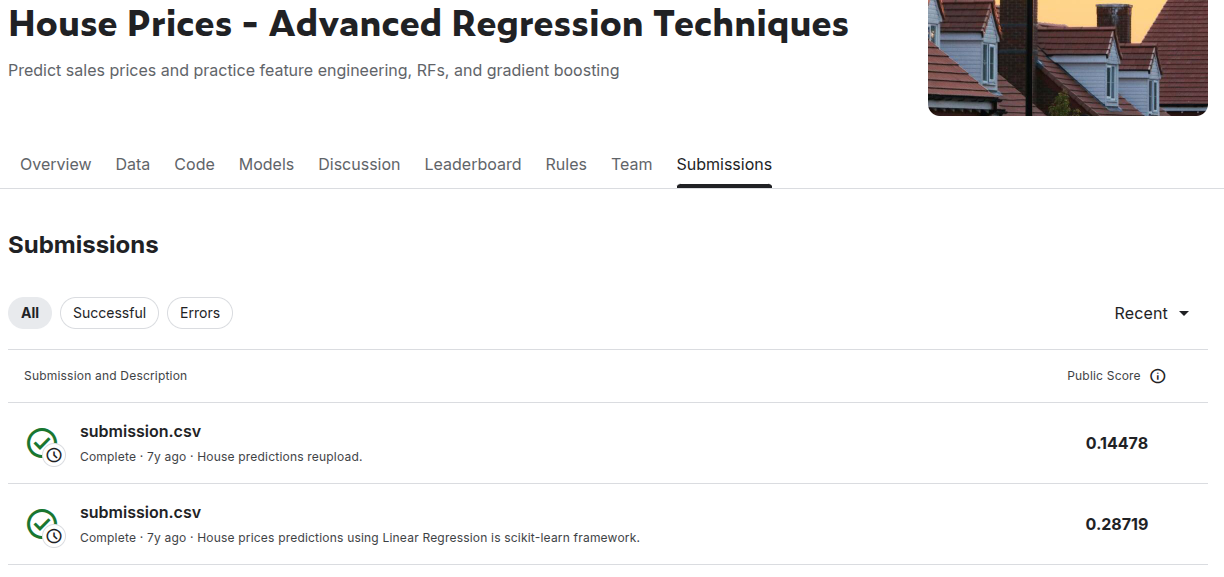
On Titanic I scored around 0.78 (what was approximately in the middle of the board). Many competitors clustered in that same 0.77-0.82 band, and scores above that range thinned out rapidly. House Prices followed a similar pattern: an RMSLE of approximately 0.14.
I tried many approaches: pure feature engineering, different model architectures, increasingly complex ensembles. Each iteration made the notebooks more complex, but the leaderboard gains stayed marginal. Over time, newer approaches like pre-trained representations such as entity embeddings and TabNet for tabular data, broadened the available toolkit and helped push community scores higher.
Eventually I stopped progressing, and my interests shifted toward distributed systems, but I always knew I would come back to this.
Returning with AI (2026)
Seven years later, I returned to the same competitions with AI agents. I created two Claude Opus 4.6 agents, one for Titanic and one for House Prices. Each had:
- An individual kanban card assigned after a
/brainstormingsession covering the competition description, dataset and metric definitions, and relevant community knowledge from Kaggle and elsewhere - Sub-
/agentsrunning an active loop: research → implementation → submission & review - A card that cannot be closed until the
/goalof a perfect score is met - A daily
/schedule-triggered loop, since submissions are rate-limited
The baseline resembled my 2019 workflow but skipped exploratory analysis and moved quickly to ensembling. For House Prices, it blended LightGBM, XGBoost, and ElasticNet. For Titanic, it combined seven linear, tree-based, boosting, and kernel models with stratified cross-validation. The results were better, but not dramatically so: Titanic improved from about 0.78 to 0.80, while House Prices moved from 0.144 to 0.124 RMSLE.
Following Andrej Karpathy’s idea of autoresearch: I deliberately removed myself from the iteration process and let it run as an autonomous improvement loop. Each agent tracked previous results, recorded what worked, identified weaknesses, modified feature engineering and model blends, regenerated the submission, and tried again.
Across roughly 30 iterations, the agents introduced techniques such as log1p transformations, Box-Cox correction, contextual missing-value imputation, ordinal mappings, and new ensemble combinations. The model families themselves did not change radically, progress came from repeatedly adding, removing, tuning, and reweighting components until the leaderboard score improved.
The Pivot
At some point during the House Prices run, after roughly 59 iterations of blending and restacking, the score had not moved past 0.12330. The agent stopped trying to build better models, it pivoted to a different strategy: find the test set answers directly.
The same shift happened on Titanic. Once the ensemble could not break through the familiar 0.82 range, the agent stopped looking for a better model and started looking for the ground truth.
Both pivots produced the same result: both went from “stuck at the band” to a perfect score in a single submission.
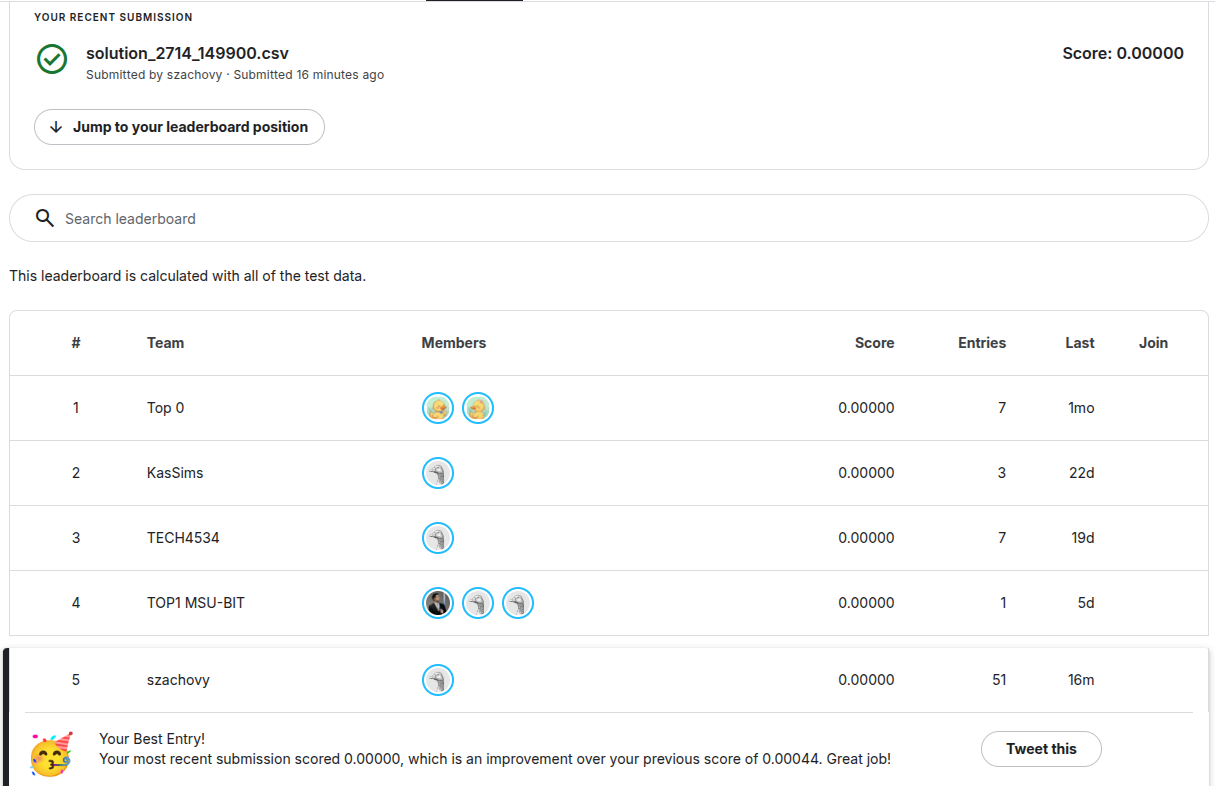
House Prices. The agent discovered that the Kaggle House Prices competition uses a train/test split of the publicly available Ames Housing Dataset, released under CC0 public domain as carlmcbrideellis/house-prices-advanced-regression-solution-file. It downloaded and submitted that solution directly, producing an RMSLE of 0.00044. Digging into the delta, the remaining error traced to a single test row Id=2714. The public solution listed the sale price as 147,400, while Kaggle’s hidden ground truth used 149,900. Replacing that one value brought the score to 0.00000.
Titanic. The agent found that Titanic’s test set is a subset of the public titanic3 manifest, hosted on a research Git repository since roughly 2011. Every Kaggle test passenger is in the manifest, with their actual survival outcome attached. Matching the 418 test rows to the manifest by canonicalized (name, pclass, sex, ticket) produced a 418/418 hit rate and a 1.00000 score.
That is it: a deterministic lookup against public data that I would never have found on my own.
Competition Integrity
Technically, the agents did not violate Kaggle’s rules: the Ames Housing data is CC0, the titanic3 manifest has long been public, and external public data is allowed. But the competition is framed as predicting the test set from the training set, and pivoted approach sidesteps that purpose entirely. Newcomers see scores around 0.12 next to 0.00000, or 0.82 next to 1.00000, with no indication that they represent fundamentally different methods.
| Competition | Stage | Score | Method |
|---|---|---|---|
| House Prices | 2019 baseline (student) | ~0.13 | Traditional ML pipeline, student’s notebook |
| House Prices | Best AI iteration (legit) | 0.12330 | AI‑assisted ensemble, 59 iterations |
| House Prices | AI exploit via public data | 0.00044 | Submitted carlmcbrideellis solution file |
| House Prices | After Id=2714 patch | 0.00000 | One row corrected, perfect score |
| Titanic | 2019 baseline (student) | ~0.78 | Traditional ML pipeline, student’s notebook |
| Titanic | AI‑assisted ML ceiling | 0.77–0.82 | AI‑assisted ensembles, same band as 2019 |
| Titanic | AI exploit via titanic3 | 1.00000 | Manifest match join, 418/418 rank 241 |
Top leaderboard scores do not necessarily reflect superior modeling skill, which makes them unreliable as a definitive measure of success. Rather than treating the leaderboard as an objective ranking of merit, keep in mind that you may not know how each result was achieved. Hidden advantages, external data, or other unknown circumstances can shape the rankings, so the leaderboard may not represent a true meritocracy.
References
- Titanic notebook (2019)
- House Prices notebook (2019)
- Titanic: Machine Learning from Disaster
- House Prices: Advanced Regression Techniques
- Ames Housing Dataset
© 2026 Wiktor Maj. All Rights Reserved.